Bit offers several integrations with your IDE to boost productivity.
Bit Cloud provides remote, web-based workspaces for effortless component development and collaboration. Sign up for Bit Cloud to start using Cloud Workspaces for free.
The Bit MCP server defaults to vscode and configurable to: vscode, cursor, windsurf. Configure the MCP server for your IDE:
bit mcp-server setup vscode
Add the MCP rules for generating adding the agent instructions for using Bit:
bit mcp-server rules vscode
For lightweight configuration for component consumers, use the --consumer-project. Learn more on the Bit MCP server.
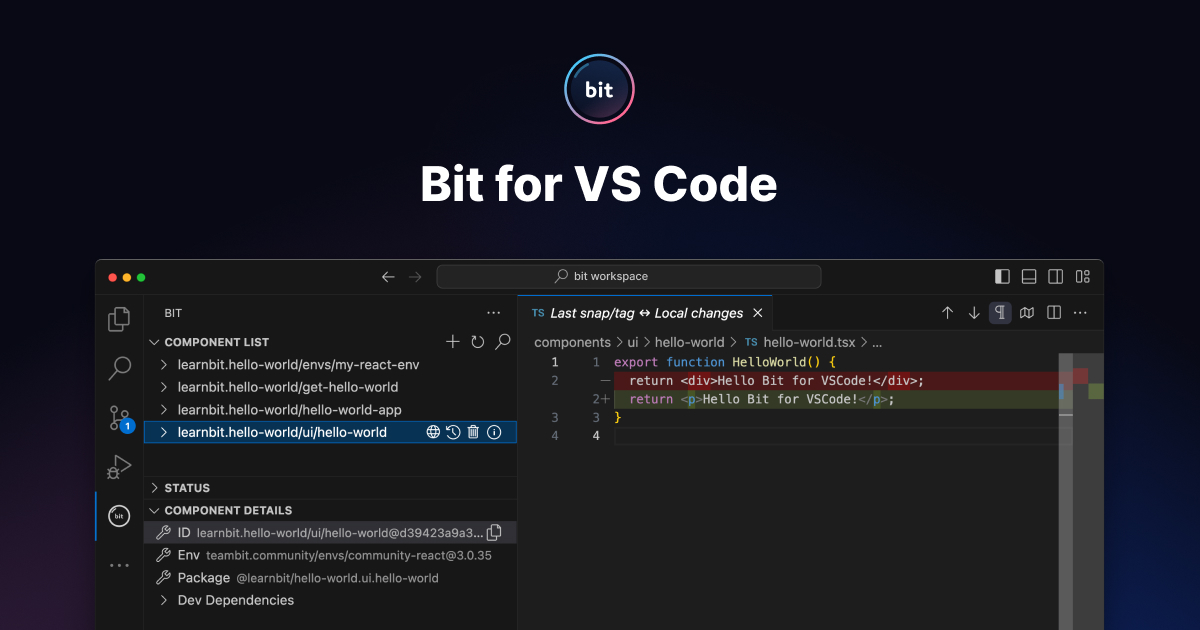
The Bit Visual Studio Code extension enhances your component development experience. Benefit from:
- Increased Productivity. Enjoy time-saving features tailored for Bit workflows.
- Integrated Source Control. Manage your Bit components directly within VSCode.
Learn more in the Bit VSCode Extension documentation.
For seamless debugging in VS Code, install our official plugin and follow these steps:
- Generate Debug Configuration: Run the command "Bit: Generate files in .vscode to allow for debugging" in your VS Code command palette.
- Start Debugging: Use the "Bit Debugger" configuration from the Run and Debug view.
To debug your Bit projects in WebStorm (or IntelliJ), create a new Node.js Run/Debug configuration with these settings:
- Node interpreter: Project (or your preferred node version)
- Node parameters: Use
--inspectto attach the node debugger - Working directory: Keep it as default (path to your project)
- JavaScript file:
node_modules/@teambit/bit/dist/app.js - Application parameters:
$Prompt$ --log error(this will prompt you for the bit command to run, you can replace it with a specific command, likestart, if you prefer) - Environment variables: Keep it empty, or add whatever you might need to run your project
Now you can run the configuration with Alt+Shift+F10, and it will prompt you for the bit command to run. You can also set a default command in the configuration, so you won't need to enter it every time.
When running bit start or bit run you can debug components by using Ctrl+Shift / ⌘⇧ and clicking on the URL printed in the terminal (localhost:3000).
This will open a new tab in your browser with the debugger attached to it. Just add a breakpoint in your code by clicking on the line number and refresh the page.