Debugging components in a Bit workspace
Debugging is an essential part of the software development process. It's common to use the console.log to debug code. But sometimes using the debugger makes the whole process efficient. It is usually important when debugging bit components, where we can step through the envs, app types, deployers, components etc.
In this guide, we will explore how to use VSCode's debugging tools to debug a Bit workspace. We will walk through the process step-by-step, explaining each parameter in detail to tailor it to your needs.
Step 1: Open VSCode's debug panel
To start a debugging session, open the VSCode debugger. This can be done by clicking on the Debugging icon in the left-hand side panel of the VSCode window or by pressing Ctrl + Shift + D.
Step 2: Create launch configuration
Workspaces generated using a starter have a launch configuration already included. Skip straight to Step 3, if you are using a workspace generated using a starter.
Next, create a launch configuration file, which tells VSCode how to start the debugger. Click on the create a launch.json file link in the top toolbar of the Debug panel or press F5 to generate a new launch.json file in the .vscode folder of your project.
Step 3: Configure the Launch Parameters
Replace the contents of the launch.json file with the following configuration:
{
  "version": "0.2.0",
  "configurations": [
    {
      "type": "node",
      "request": "launch",
      "name": "Bit Debugger",
      "program": "${workspaceFolder}/node_modules/@teambit/bit/dist/app.js",
      "args": "${input:bitCommand}",
      "outFiles": [
        "${workspaceFolder}/**/*.js",
        "dist/**/*.js"
      ],
      "console": "integratedTerminal",
      "sourceMaps": true,
      "internalConsoleOptions": "neverOpen",
      "cwd": "${workspaceFolder}"
    }
  ],
  "inputs": [
    {
      "id": "bitCommand",
      "type": "promptString",
      "description": "Enter the command without the 'bit' prefix"
    }
  ]
}Let's break down each parameter in the configuration:
- "version": Specifies the version of the launch configuration format.
- "configurations": Contains an array of debugging configurations. In this case, we have only one configuration.
- "type": Specifies that this is a Node.js debugging session.
- "request": Specifies that we want to start a new debugging session.
- "name": A descriptive name for the debugging session.
- "program": The path to the Bit CLI executable.
- "args": The command to be passed to the Bit CLI. This will be entered by the user when the debugging session starts.
- "outFiles": The path(s) to the JavaScript files generated by the Bit CLI. This is necessary for the debugger
- "console": Specifies that we want to use an integrated terminal to run the Bit CLI.
- "sourceMaps": Enables source mapping, which allows the debugger to map the generated code back to the original source code.
- "internalConsoleOptions": Specifies that we don't want to open a new console when the debugging session starts.
- "cwd": The current working directory for the debugging session.
- "runtimeExecutable" (Optional): The path to the Node.js executable. This is optional and should only be specified if you have a version of Node.js installed that is not compatible with the debugger. You can use a version manager like NVM to switch to a compatible version of Node.js.
- "inputs": Specifies the input prompt for the bitCommand parameter. This allows the user to enter a command without the bit prefix when the debugging session starts.
Save the launch.json file by clicking on the save icon in the top right corner of the VSCode window or by pressing Ctrl + S.
Step 3: Start a debugging session
Open the launch.json file and start a debugging session by clicking on the start debugging button in the top toolbar of the Debug panel or by pressing F5.
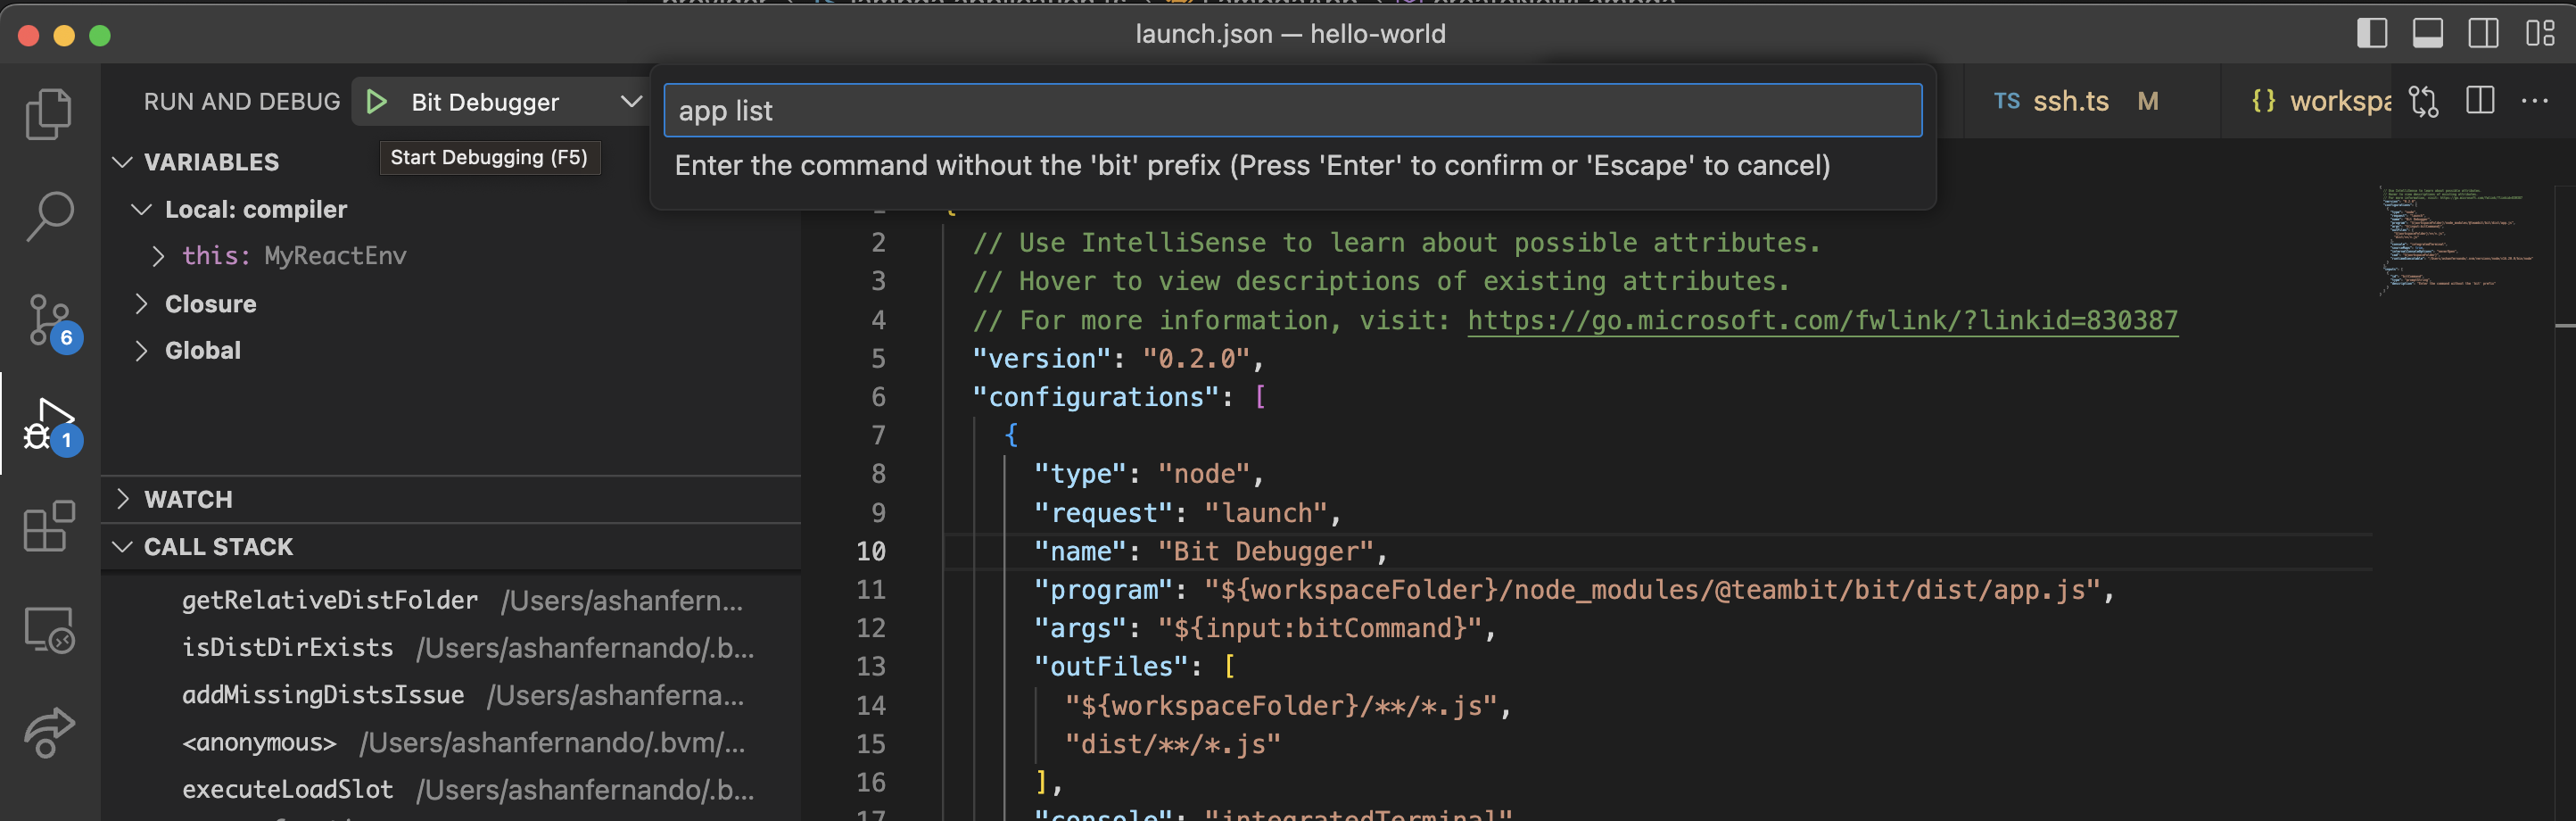
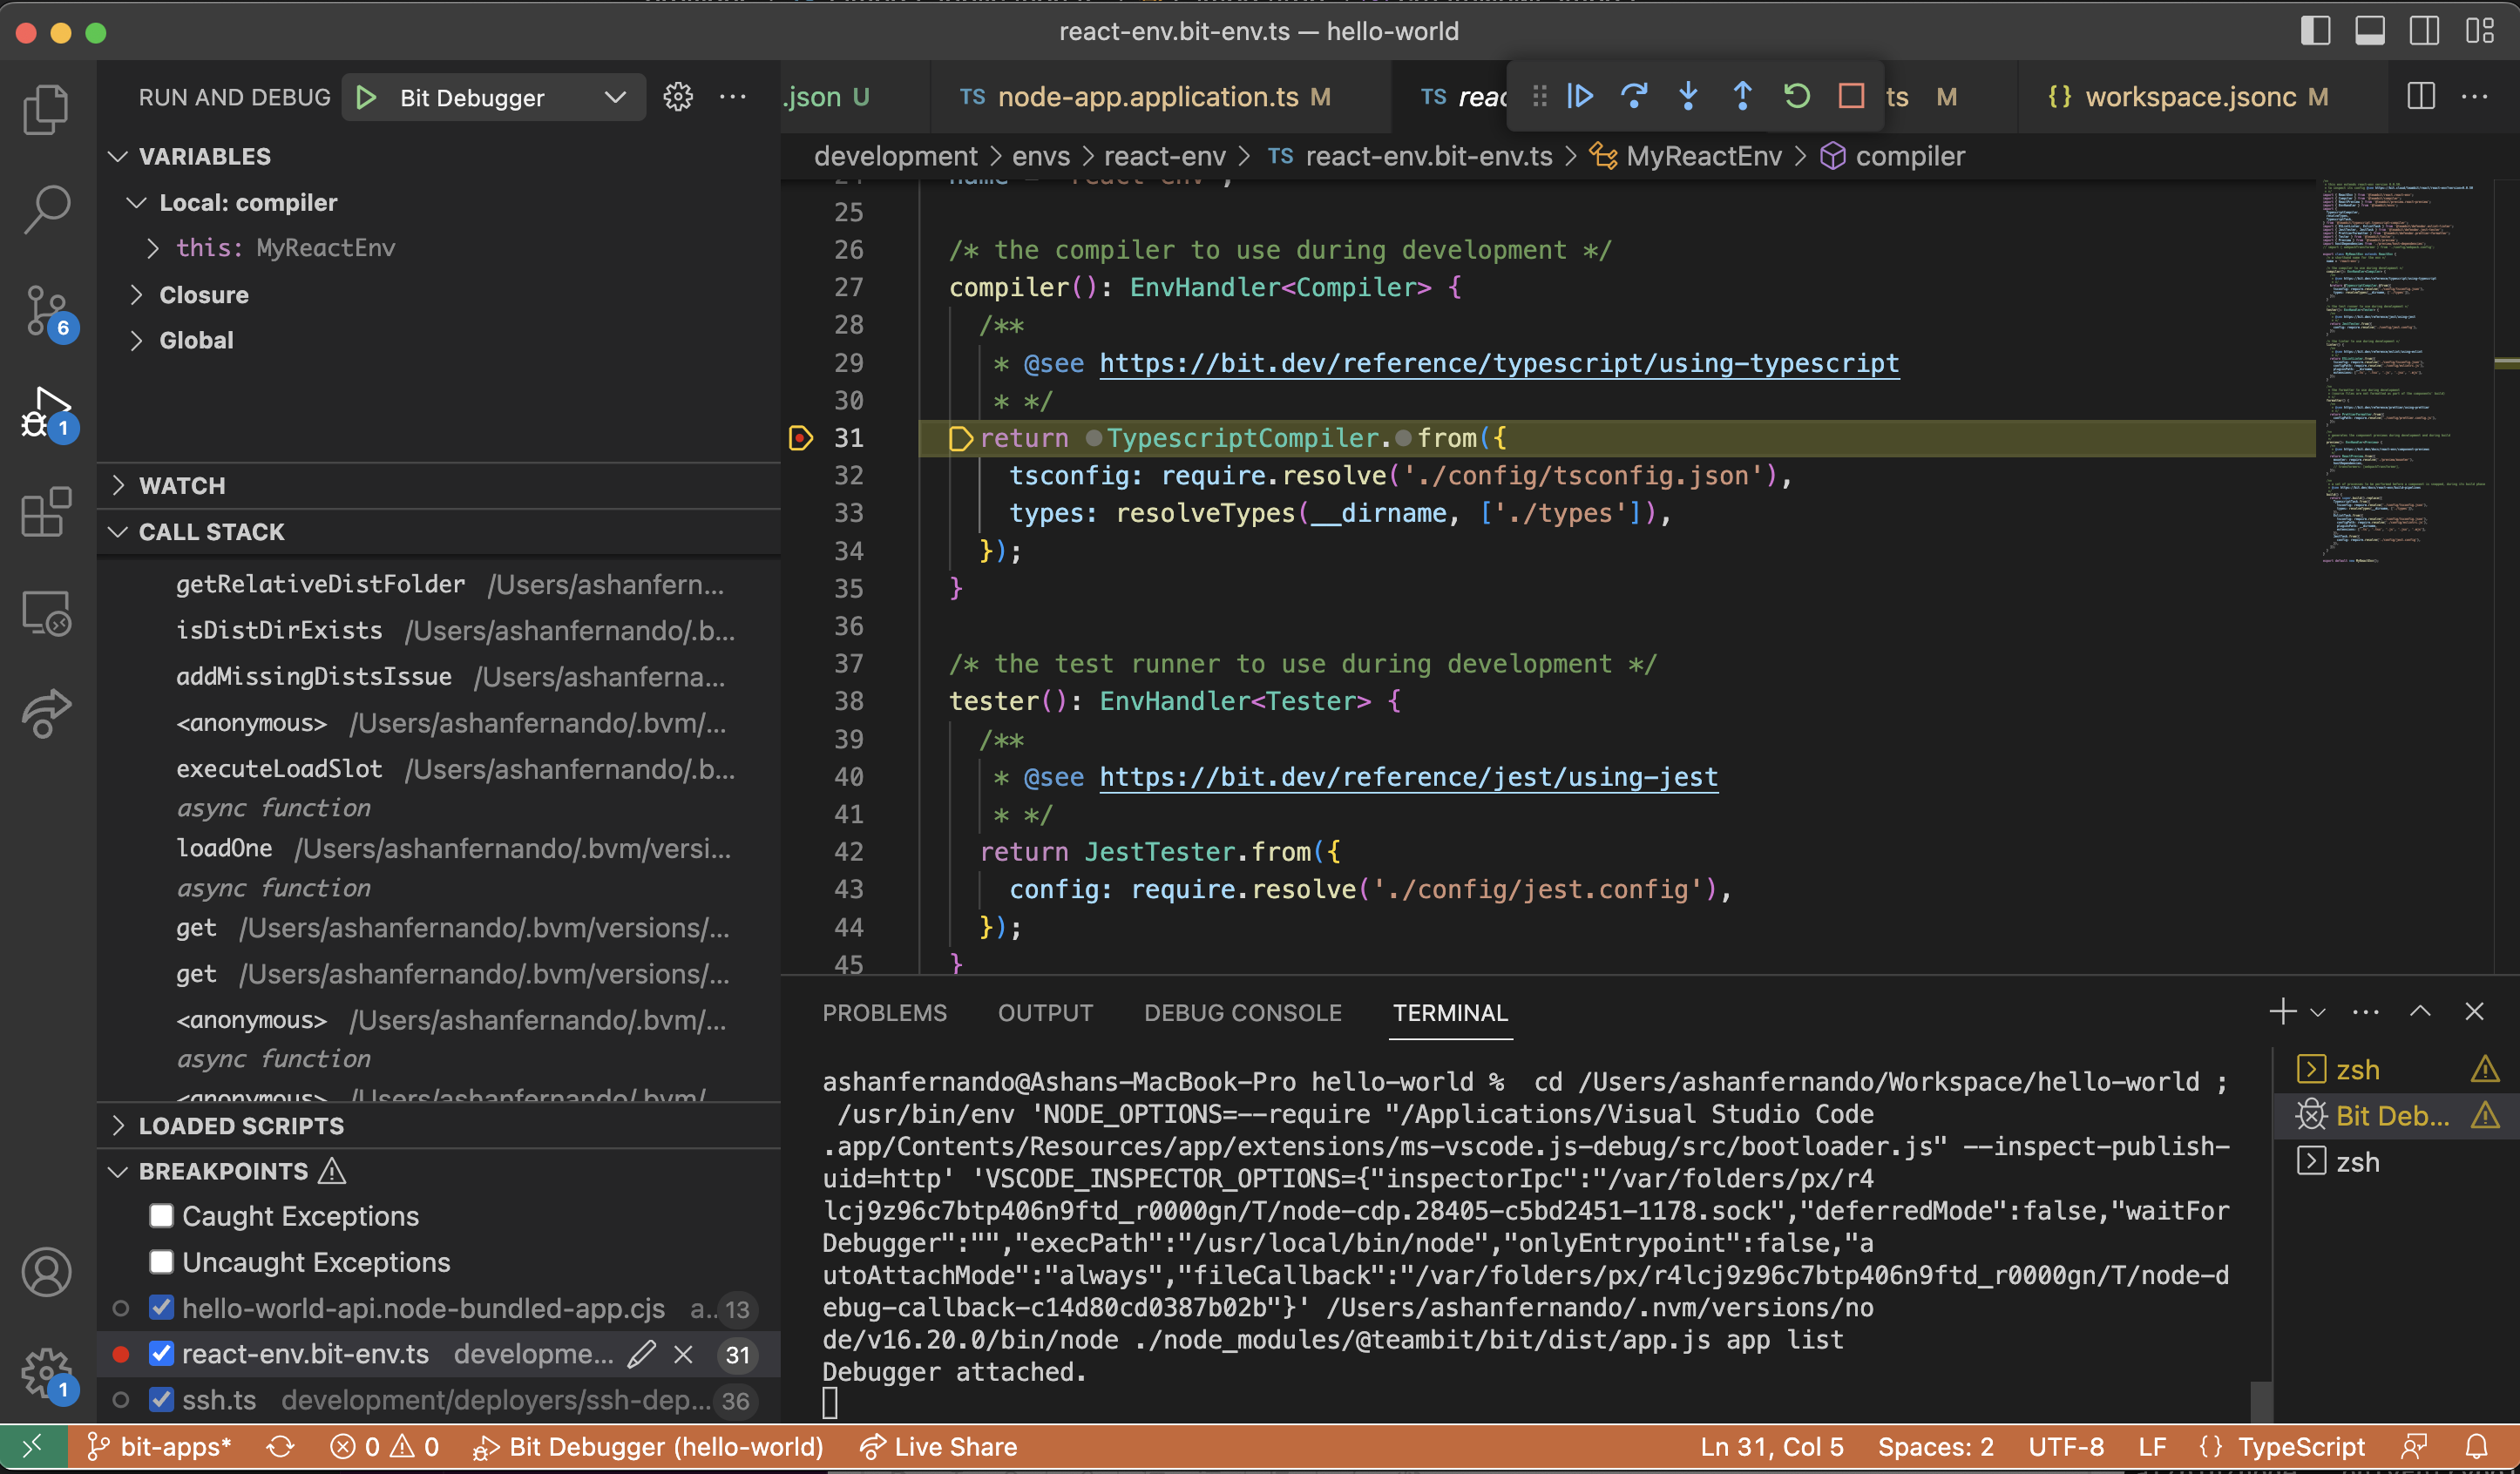
When prompted, enter a Bit CLI command without the bit prefix and press Enter to start the debugging session. For example, you can use commands like status, app list etc. The debugger will break at any breakpoint set in the source code.
Resolving debugger Node version compatibility issues
If you have a version of Node.js installed that is not compatible with the debugger, you can use a version manager like NVM to switch to a compatible version. For example, if you have Node.js version 16.20.1 installed and the debugger is only compatible with version 16.20.0, you can use NVM to switch to version 16.20.0 by running the following commands in the terminal:
Then you can set the runtimeExecutable path pointing to the compatible node version.
"runtimeExecutable": "/Users/<your user>/.nvm/versions/node/v16.20.0/bin/node"If you use nvm you can find the path by using the following command.
Once you have switched to a compatible version of Node.js, you can start a debugging session as described in Step 4.